Lunar PitProbe: Auto Landing & Efficient Rover Routing
- Tech Stack: C/C++ (Eigen3, Embree 3.0, fmt), GitHub
- Summary
- Created an algorithm as a part of a team of four students to automate and improve the way to evaluate the best possible landing sites around pits on lunar surfaces based on the mesh grid data of the surface
- Implemented path planning algorithm that was used to identify points of entry for the rover to get close to the pit and to grab samples and photos of the pit in the most efficient way using A-star algorithm
- In-Depth
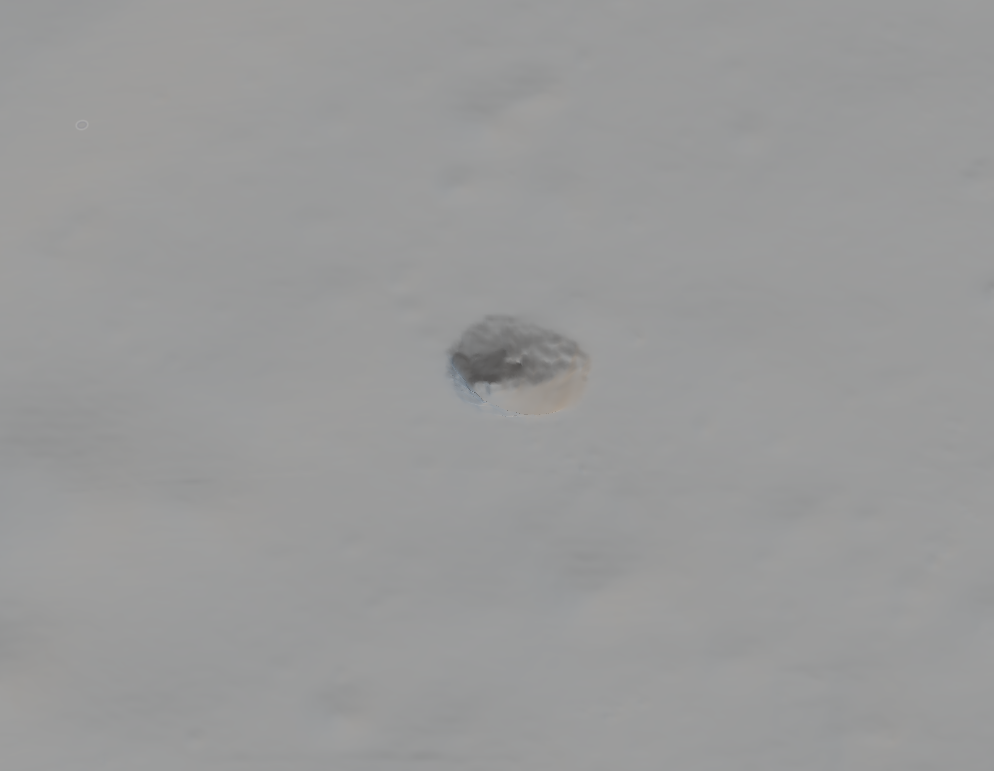
Fig-1 3D Render of Lacus Mortis Pit Introduction
The following project was conducted in collaboration with Planerty Labs at CMU as part of a larger project aimed at exploring the Lunar surface, particularly low-light zones like the pits. These areas cannot be observed by cameras from satellites orbiting the moon, and sending the rover to explore them is not an option as the rover must maintain a line of sight with the lander (as shown in Fig-2) at all times to transmit information such as photos and samples. Therefore, an algorithm was developed to find the optimal landing site and generate an optimal path for the rover to travel. The needed input for the algorithm is a 3D render of the landing surface (Fig-1).
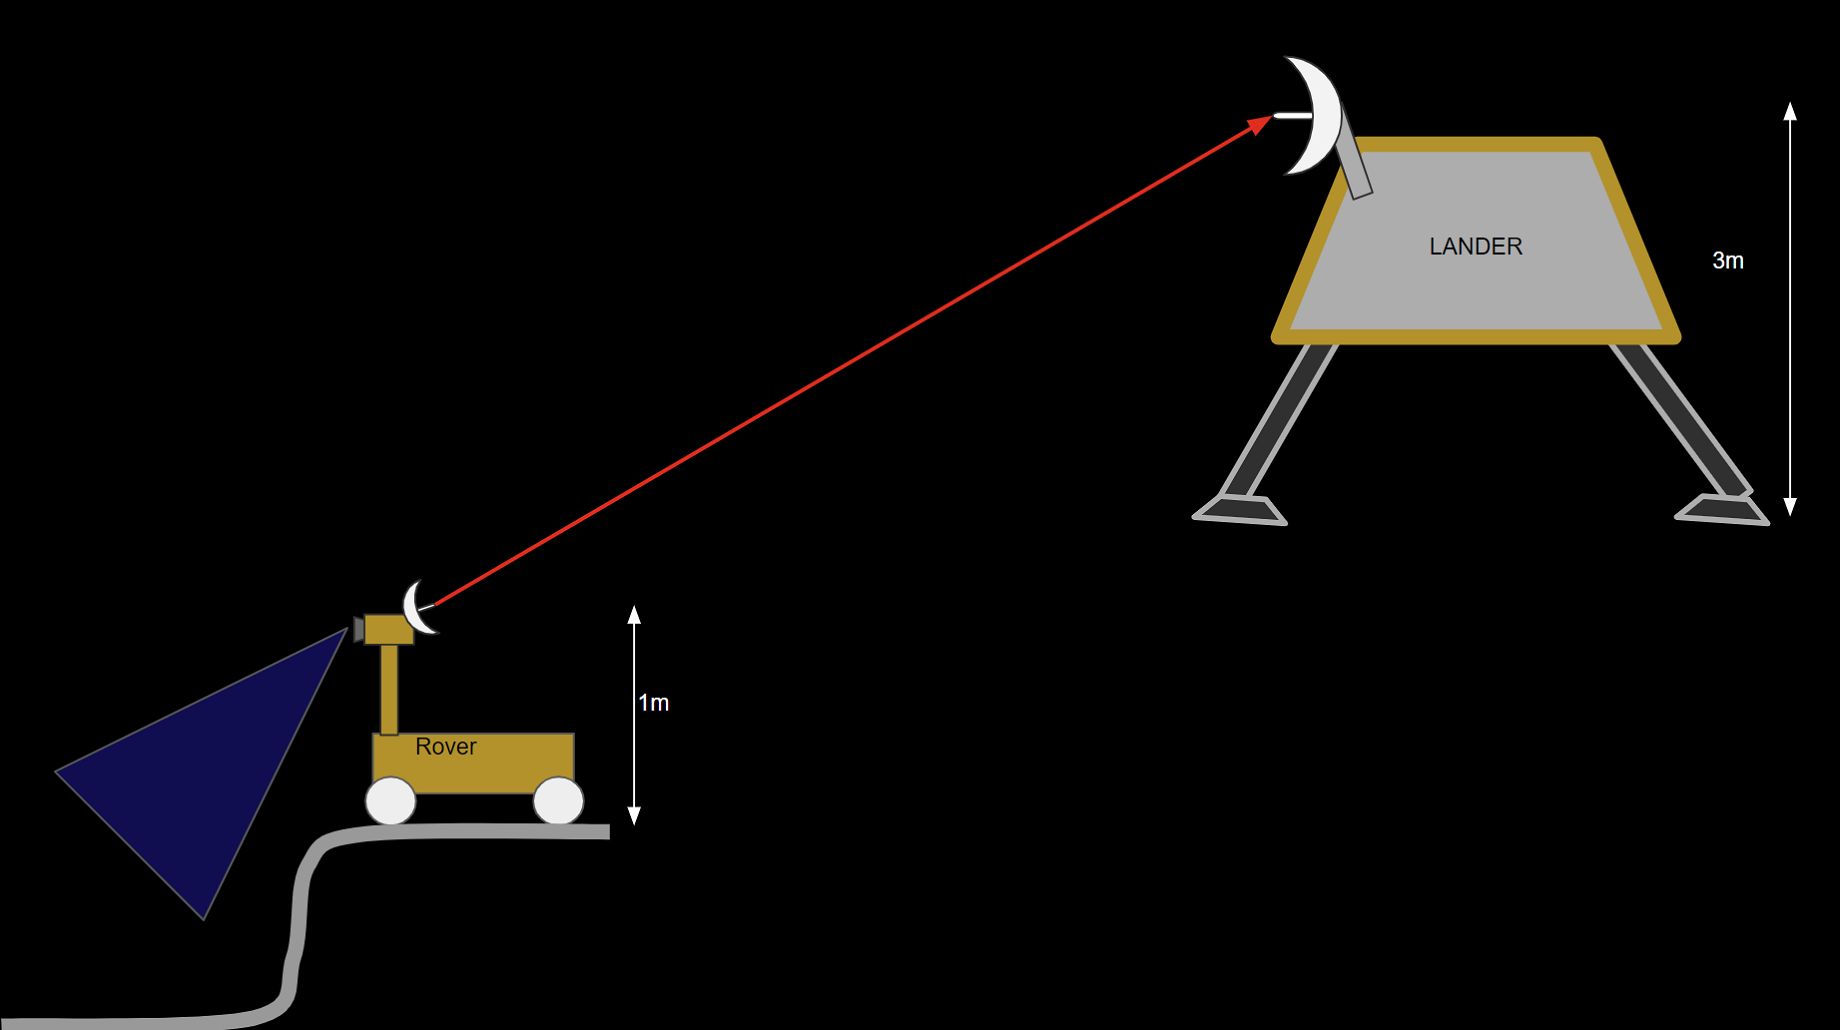
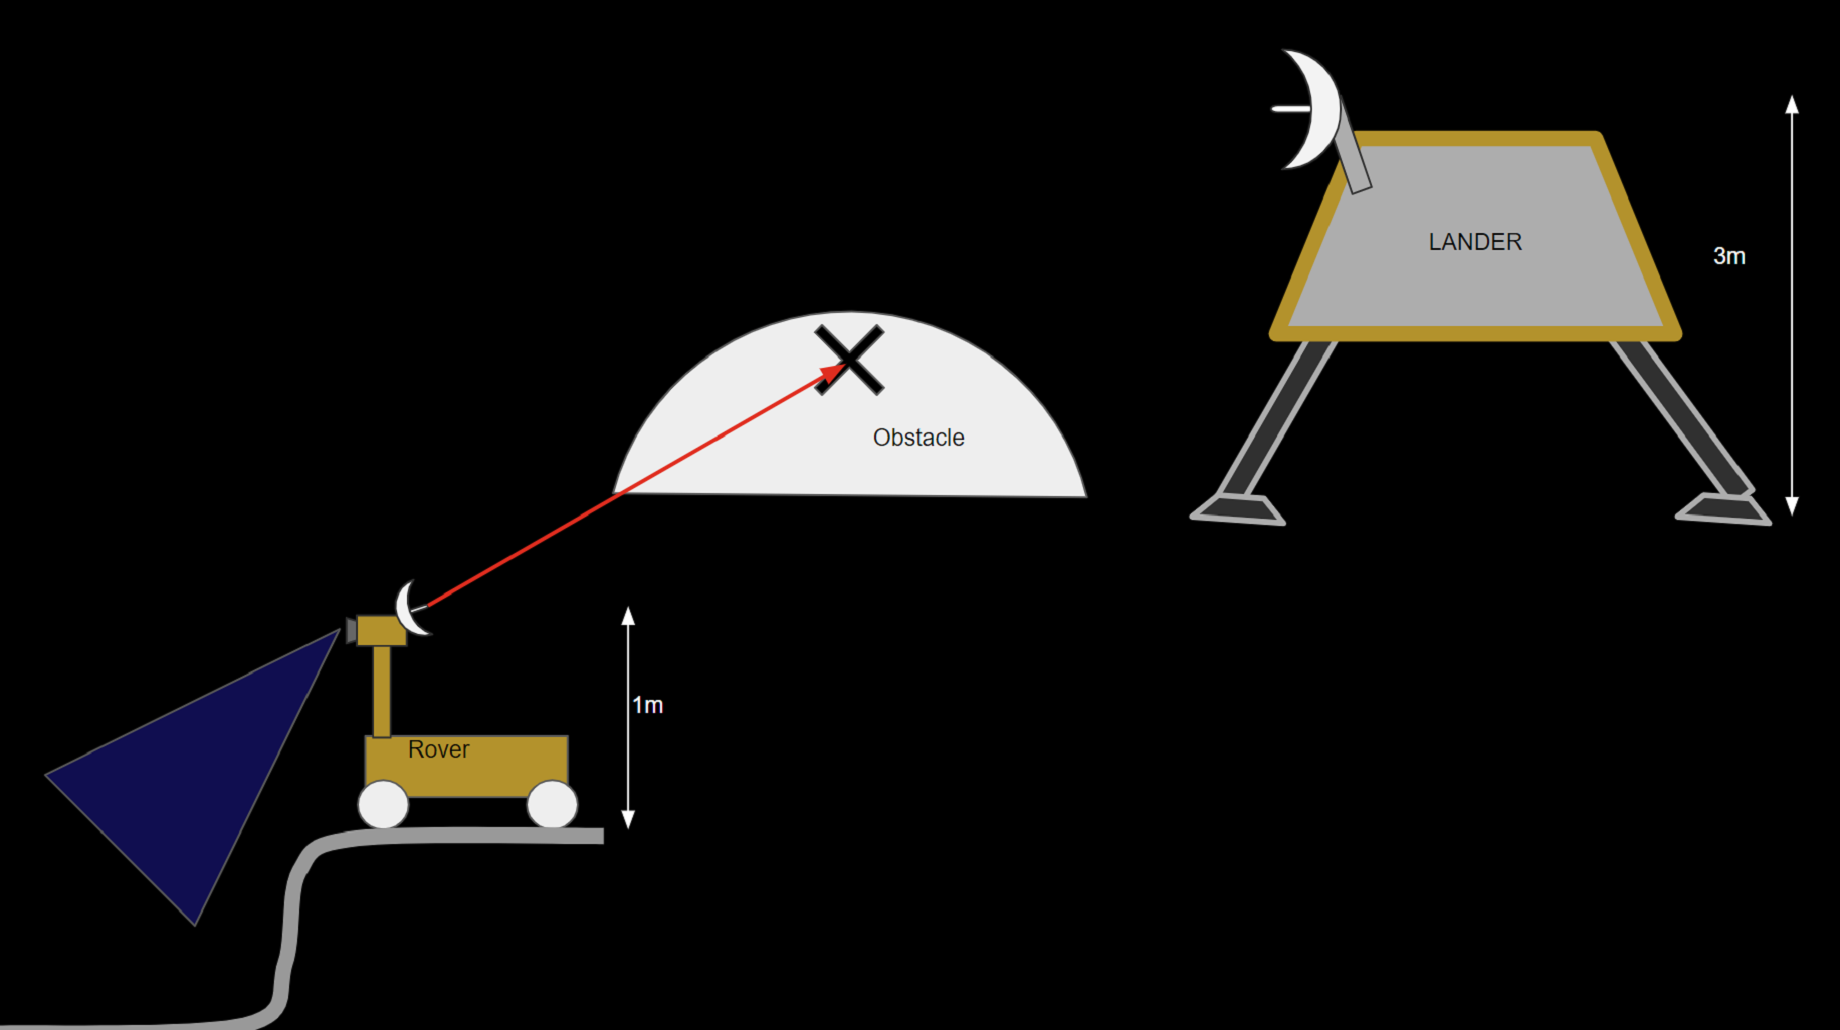
Fig-2 Line of Sight of Rover Methodology
The project aimed to use a 3D render of the surface of the Moon to generate a depth map of the surface. To achieve this, the project utilized ray tracing, a technique used in computer graphics to simulate the path of light rays as they interact with objects in a scene. By using ray tracing to render the surface of the moon, the project was able to calculate the distance between the camera (or the observer) and each point on the surface, which allowed for the generation of a depth map. This depth map then enabled the project to generate a slope map and a Line of Sight (LOS) map.Depth Mapping
We used ray tracing in this project to render a 3D model of the lunar surface and obtain depth information that was essential in generating the slope and LOS maps, as well as identifying optimal landing sites and paths for the rover.The depth map was then used to generate a slope map, where darker shades represented higher slopes or inaccessibility. The rover had physical constraints such as maintaining a line of sight with the lander, slope constraints, and distance constraints. The landing site needed to be evaluated based on these parameters. The algorithm was developed to identify the best landing site and the most optimal path for the rover to explore. The algorithm employed a complex G-Score function to evaluate all possible landing sites and find the optimal path for the rover to travel.
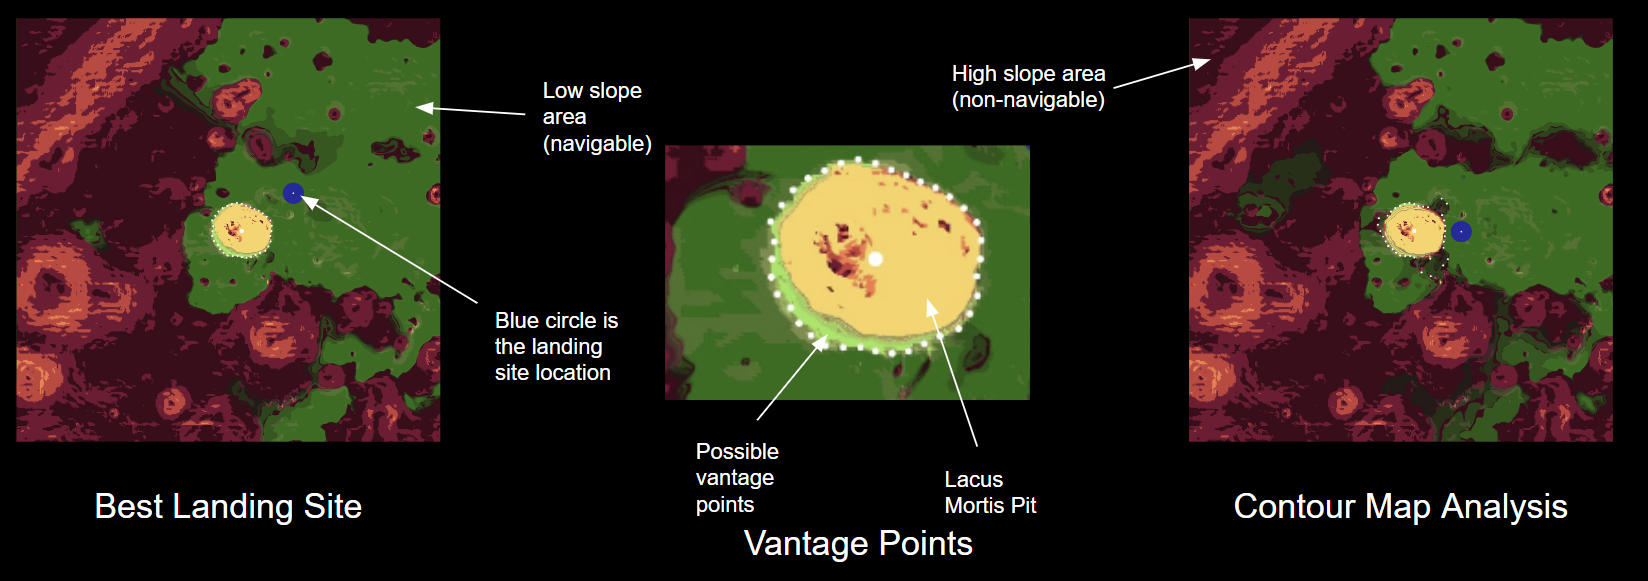
Fig-3 Line of Sight of Rover LOS Mapping
The Line of Sight Map (LOS Map) was generated to represent all the points on the map where the lander could communicate with the rover, and a LOS Aggregate Map was also created to ensure the landing site covered the entire pit in its line of sight. This had to be done because the lander could land anywhere in the targeted landing circle and due to that there could be numerous possibility based on where the lander lands on the circle. Hence, we generate the LOS Aggregate Map to make sure we are considering all the different possibilities. These can be seen in Fig-3 and Fig-5 where the different intensity of Green shows the Coverage of the particular points based on different landing locations in the circle. For accomplishing the true purpose of the project of exploring the pits on the lunar surface thirty-six sites called vantage points were generated around the pit space at 10-degree intervals from the center of the pit, and the optimal sites were determined by overlaying the LOS map. A complex G-score function was created to assign penalties to different parameters and generate a ranking to select the best path.
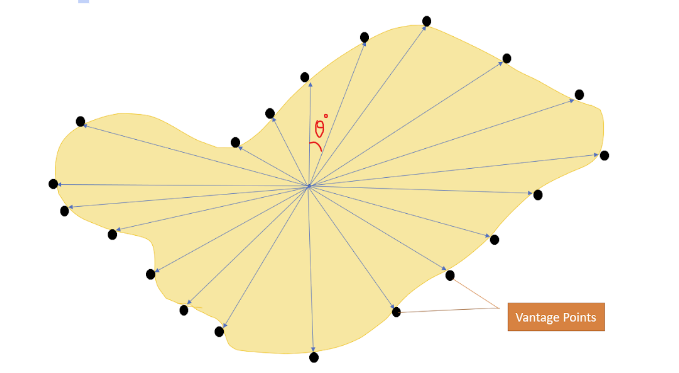
Fig-4 Vantage points are generated based on where the meet the LOS coverage and the Pits border In Fig-5 you can see the algorithm going through different possible landing sites and evaluating which is the best landing site for the rover.
Fig-5 Algorithm going though various landing sites (blue circle) and the corresponding changes in the LOS Map (Green Shade) based on the Depth Map (Red Shades) Results
The results of the project were successful, with an algorithm that was able to find a list of the best landing sites and generated an optimal path for the rover to traverse around the Lacus Mortis Pit. The code generated has also been done in a very modular way and can be used to generated paths and best landing sites by altering the G-Score function based on the requirements. Also, an overlay extension (called mapWindow) was also created, allowing the generated path to be overlaid with the actual image from the Moon, making it easier to visualize and justify.
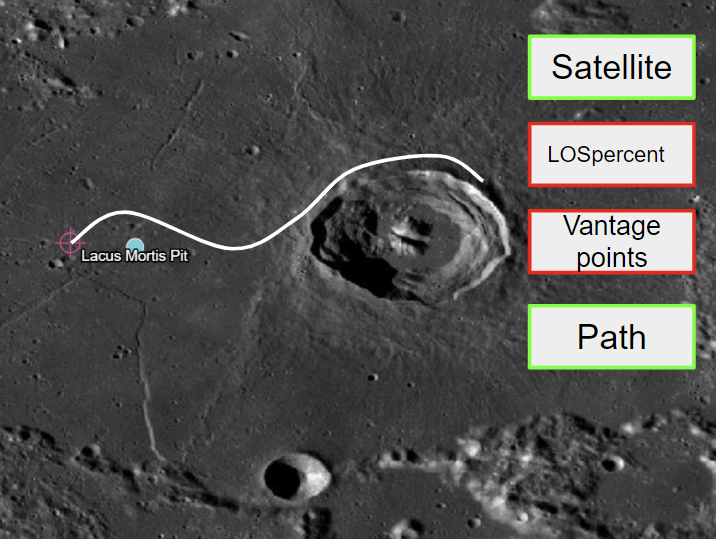
Fig-6 Currently shows the Generated Path and Satellite Image Overlay